2D Report
2D Report allows you to analyze test data across two dimensions in a single view. Break down data by categories to answer complex questions with immediate results. Generate the 2D Report using the Group By or Time Frame report type. Both report types are available for test cases, requirements, and test executions.
The report retrieves data directly from projects using Zephyr Query Language (ZQL), ensuring the data remains current and accurate. You can view results in multiple formats, including bar charts, grouped bar charts, and tables, and export each view as needed.
Configuring 2D Report
Configure a 2D report to analyze test data by grouping it across two dimensions, such as folder, phase, tag, or custom field.
Note
You can select a maximum of 50 releases across all projects.
Perform the following steps to configure the 2D Report:
On the Dashboard page, click Add Gadget.
Select the 2D Report Gadget.
In the configuration pane, enter or select values for the following fields:
Project- Select one or more projects to include in the report.
Release - Select one or more releases in the selected projects.
Entity - Choose the entity to report on, such as Test Case, Requirement, or Test Execution.
Report Type - Select the report type you want to generate: Group By or Time Frame. You can use the Time Frame Report for test cases, requirements, and test executions.
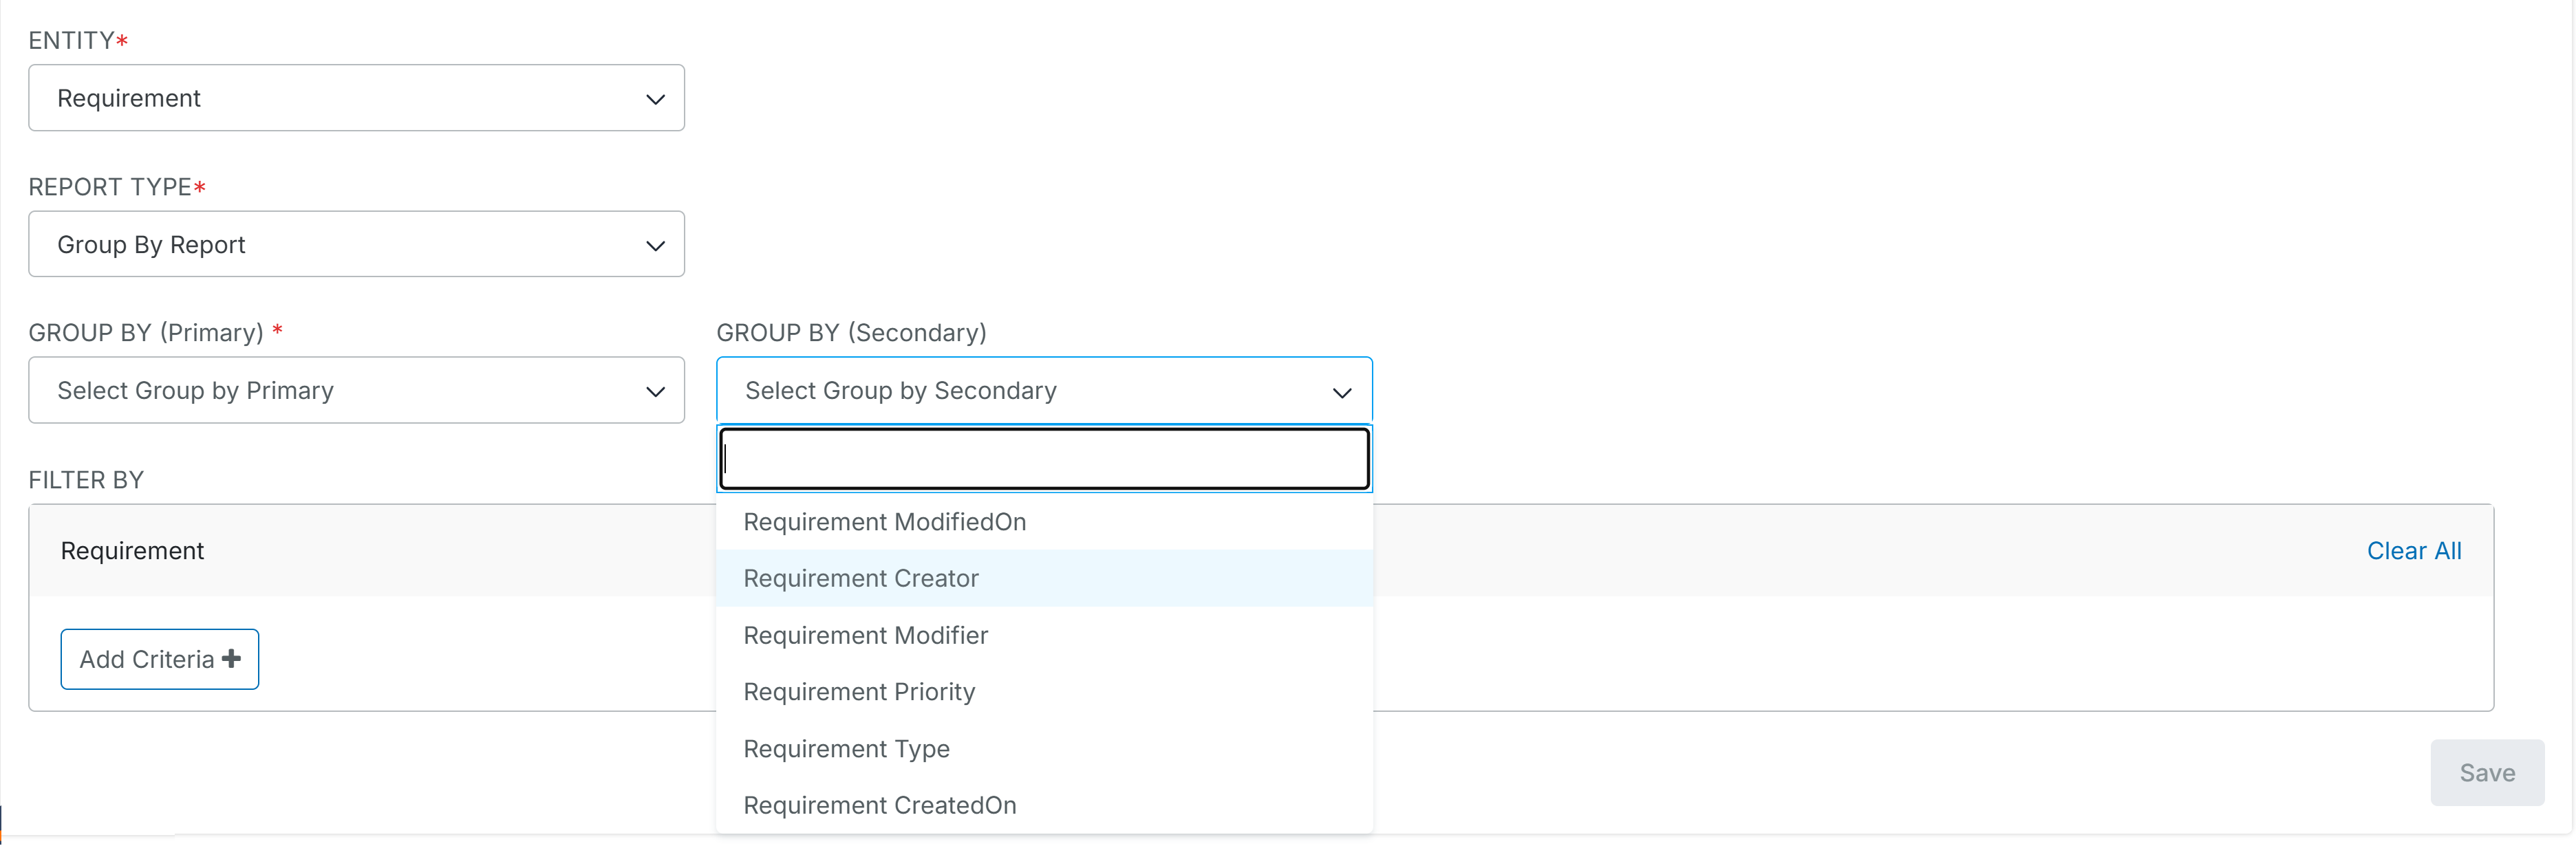
Group By - Use Group By to organize report data by one or more dimensions.
Group By (Primary) - Select the primary dimension. This defines the main grouping and appears on the X-axis in charts.
Group By (Secondary) - (Optional) Select a secondary dimension to further break down the data in each primary group.
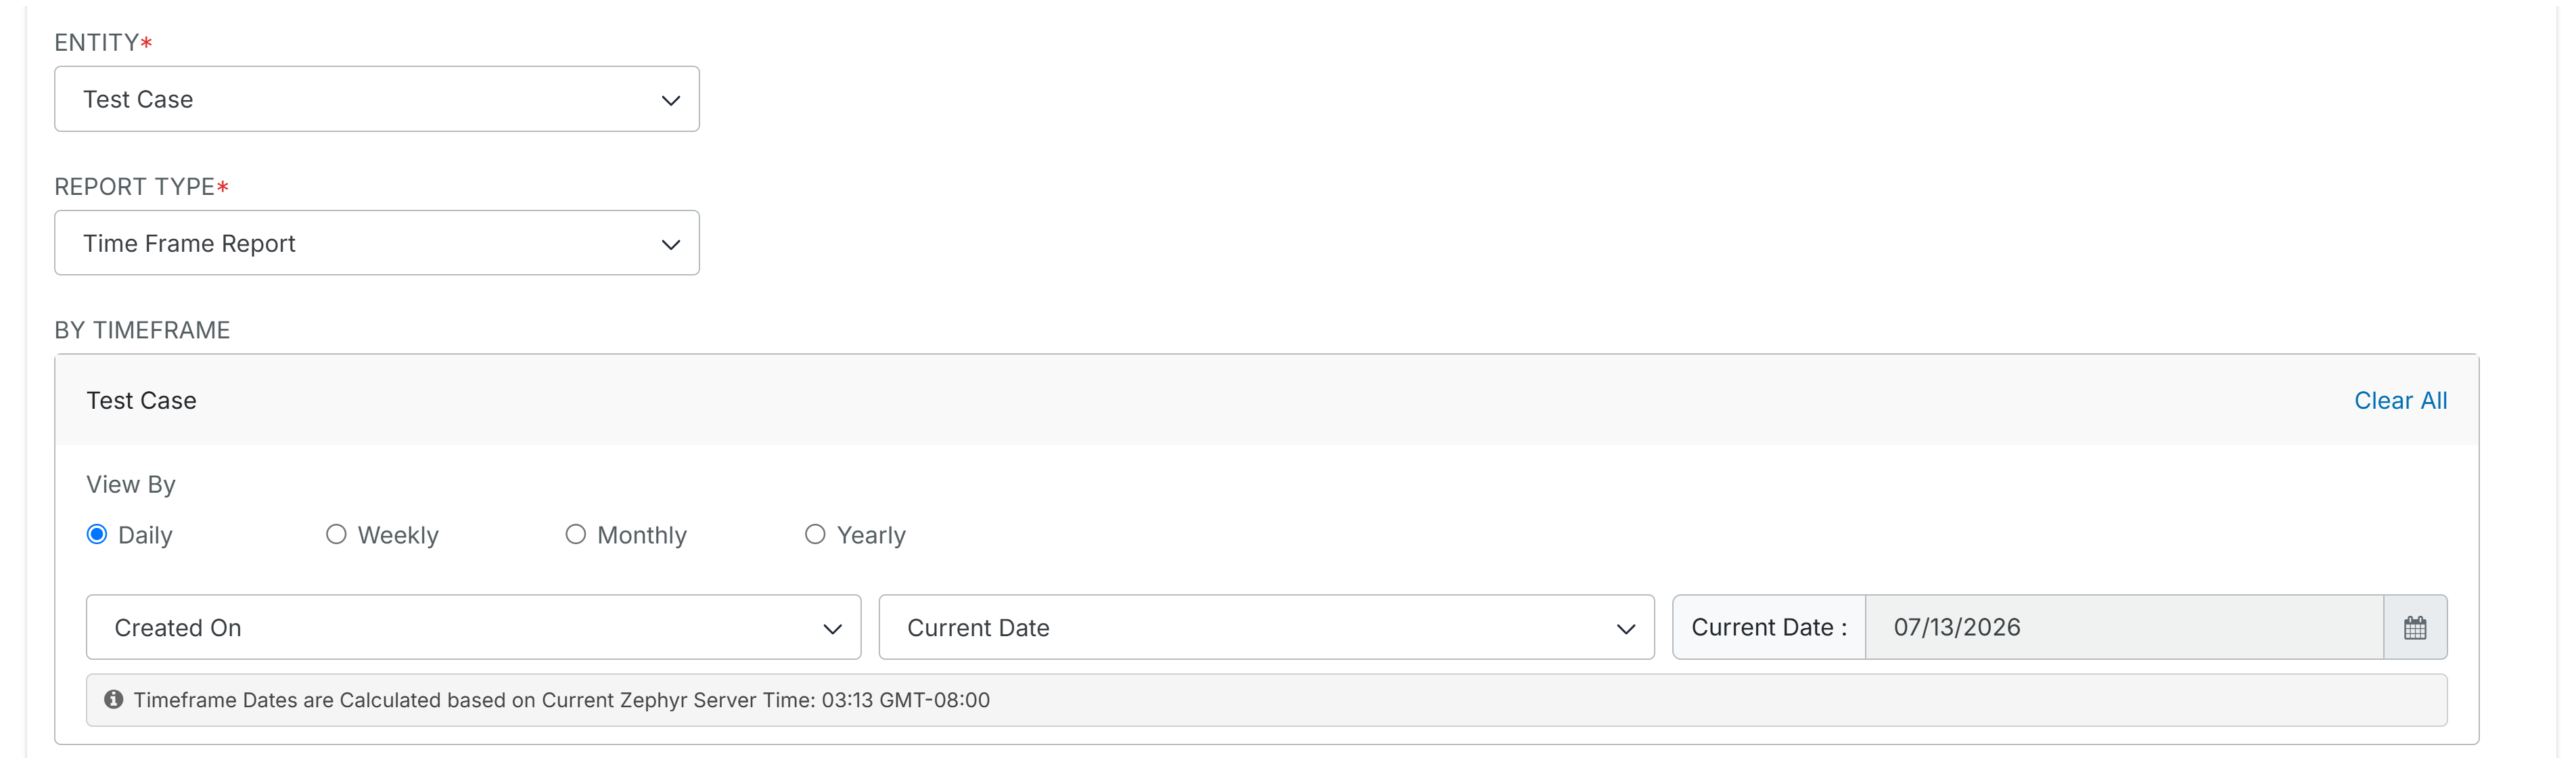
Time Frame - Time Frame reporting is available for test cases, requirements, and test executions. The Time Frame Report groups the data by time intervals. Select from the following options:
Daily - Groups the data by day for activity tracking.
Weekly - Groups the data by week.
Monthly - Groups the data by months.
Yearly - Groups the data by year for high-level trend analysis.
Filter By - (Optional) Click Add Criteria to refine the data, for example, to view only automated test cases.
Click Save to apply the configuration to generate the report.
View Report Results
After you save the configuration, the report renders on the dashboard. You can switch between available view options at any time.
Bar Chart
This chart displays each group as a bar, where the bar length represents the count. If a secondary grouping is applied, the bars are color-coded based on the secondary dimension.
Note
Bar Chart is limited to 100 bars. The chart is disabled when the bar count exceeds this limit. Refer to the tooltip on the disabled chart button to apply filters or view results in tabular format.

Tabular View
The tabular view displays data in a table format with raw counts. Rows represent the primary groups, while columns represent the secondary dimension or dates. A total row appears at the bottom for summary values.

Vertical Grouped Bar Chart
This chart displays the same data as the bar chart in a vertical, grouped layout. Bars appear side by side for each category, which makes it easier to compare multiple projects on the same scale.
Note
Vertical Grouped Bar Chart is limited to 100 bars. The chart is disabled when the bar count exceeds this limit. Refer to the tooltip on the disabled chart button to apply filters or view results in tabular format.

Table Summary
Select the Table Summary toggle to display a data table below the chart. The table shows the exact values for each bar, which helps when visual comparison is difficult or when precise data is required.

Export 2D Report
Use the export icons to save the report. You can export the full report view as a PDF, download the chart as an image, or export the underlying data as a structured file.